 O pessoal do NY Times publicou um ótimo artigo no final de 2014 sobre o crescimento dos números de homens que não trabalham. A pergunta que não quer calar é: o que essas pessoas fazem então?
Abaixo dá para entender melhor esse fenômeno e como chegamos nisso.
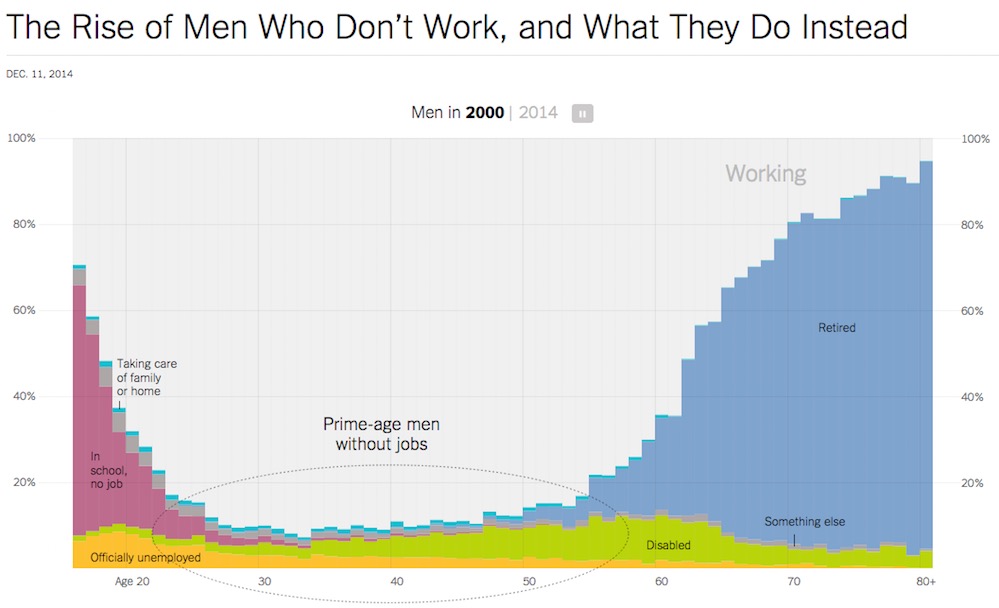
At every age, the chances of not working have changed in the last 15 years. Teenagers are far more likely not to work. Older people are retiring later and working more. In the ages in between — the periods of life when most people work — the changes have been smaller, but they are still substantial.
In the late 1960s, almost all men between the ages of 25 and 54 went to work. Only about 5 out of every 100 did not have a job in any given week. By 2000, this figure had more than doubled, to 11 out of every 100 men. This year, it’s 16. (People in the military, prison and institutions are excluded from these figures.)
Of course, the economy was stronger in 2000 than it is today, with a lower official unemployment rate — the share of people not working and actively looking for work — than today. But for prime-age men, the rise in official unemployment explains only about one-third of the increase in not working.
The remaining two-thirds is made up of those who are not working and not looking for work. Every month, the Census Bureau and the Bureau of Labor Statistics ask these men who are not in the labor force to describe their situation. Are they disabled, ill, in school, taking care of house or family, in retirement, or something else?